

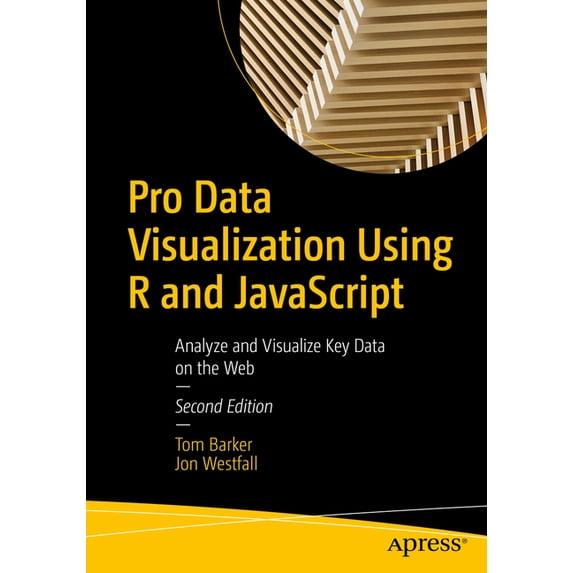
Pro Data Visualization Using R and JavaScript: Analyze and Visualize Key Data on the Web, (Paperback)
Key item features
- Pro Data Visualization Using R and JavaScript: Analyze and Visualize Key Data on the Web, (Paperback)
- Author: Tom Barker
- ISBN: 9781484272015
- Format: Paperback
- Publication Date: 2021-10-08
- Page Count: 274
Specs
Author, Tom Barker
Book format, Paperback
Genre, Computing & Internet
Pages, 274
Age group, Adult
About this item
Product details
Use R 4, RStudio, Tidyverse, and Shiny to interrogate and analyze your data, and then use the D3 JavaScript library to format and display that data in an elegant, informative, and interactive way. You will learn how to gather data effectively, and also how to understand the philosophy and implementation of each type of chart, so as to be able to represent the results visually.
With the popularity of the R language, the art and practice of creating data visualizations is no longer the preserve of mathematicians, statisticians, or cartographers. As technology leaders, we can gather metrics around what we do and use data visualizations to communicate that information. Pro Data Visualization Using R and JavaScript combines the power of the R language with the simplicity and familiarity of JavaScript to display clear and informative data visualizations.
Gathering and analyzing empirical data is the key to truly understanding anything. We can track operational metrics to quantify the health of our products in production. We can track quality metrics of our projects, and even use our data to identify bad code. Visualizing this data allows anyone to read our analysis and easily get a deep understanding of the story the data tells. This book makes the R language approachable, and promotes the idea of data gathering and analysis mostly using web interfaces.
What You Will Learn
- Carry out data visualization using R and JavaScript
- Use RStudio for data visualization
- Harness Tidyverse data pipelines Apply D3 and R Notebooks towards your data
- Work with the R Plumber API generator, Shiny, and more
Who This Book Is For
Programmers and data scientists/analysts who have some prior experience with R and JavaScript.
- Pro Data Visualization Using R and JavaScript: Analyze and Visualize Key Data on the Web, (Paperback)
- Author: Tom Barker
- ISBN: 9781484272015
- Format: Paperback
- Publication Date: 2021-10-08
- Page Count: 274
Specifications
Publication date
Author
Book format
Genre
Warranty
Warranty information
Similar items you might like
Visualisation de Données Volumineuses À l'Aide de Nanocubes, (Paperback) $49.00
 $4900current price $49.00
Visualisation de Données Volumineuses À l'Aide de Nanocubes, (Paperback)
The Data Analytics Playbook: Your Guide to Analytics in Python, (Paperback) $29.99
 $2999current price $29.99
The Data Analytics Playbook: Your Guide to Analytics in Python, (Paperback)
Cours d'Analyse Mathématique. Théorie En Fonctions Analytiques, (Paperback) $38.95
 $3895current price $38.95
Cours d'Analyse Mathématique. Théorie En Fonctions Analytiques, (Paperback)
Managing and Visualizing Your BIM Data: Understand the fundamentals of computer science for data visualization using Aut, (Paperback) $46.99
 $4699current price $46.99
Managing and Visualizing Your BIM Data: Understand the fundamentals of computer science for data visualization using Aut, (Paperback)
Pre-Owned Data Visualization: Exploring and Explaining with Data (Paperback) 035763134X 9780357631348 $34.49
 2 optionsAvailable in additional 2 options$3449current price $34.49
Pre-Owned Data Visualization: Exploring and Explaining with Data (Paperback) 035763134X 9780357631348
Fundamentals of Data Visualization: A Primer on Making Informative and Compelling Figures, (Paperback) $47.00
 $4700current price $47.00
Fundamentals of Data Visualization: A Primer on Making Informative and Compelling Figures, (Paperback)
Pre-Owned The Big Book of Dashboards: Visualizing Your Data Using Real-World Business Scenarios (Paperback) 1119282713 9781119282716 $14.10
 $1410current price $14.10
Pre-Owned The Big Book of Dashboards: Visualizing Your Data Using Real-World Business Scenarios (Paperback) 1119282713 9781119282716
Data Visualization with D3 and AngularJS, (Paperback) $50.99
 $5099current price $50.99
Data Visualization with D3 and AngularJS, (Paperback)
Introduction to People Analytics: A Practical Guide to Data-Driven HR, (Paperback) $32.49
 $3249current price $32.49
Introduction to People Analytics: A Practical Guide to Data-Driven HR, (Paperback)
A Primer in Biological Data Analysis and Visualization Using R, (Paperback) $45.38
 $4538current price $45.38
A Primer in Biological Data Analysis and Visualization Using R, (Paperback)
Deep Data Analytics for New Product Development, (Paperback) $49.95
 $4995current price $49.95
Deep Data Analytics for New Product Development, (Paperback)
Interactive Data Visualization with Python - Second Edition: Present your data as an effective and compelling story, (Paperback) $44.99
 $4499current price $44.99
Interactive Data Visualization with Python - Second Edition: Present your data as an effective and compelling story, (Paperback)
Learning Responsive Data Visualization, (Paperback) $50.99
 $5099current price $50.99
Learning Responsive Data Visualization, (Paperback)
R Programming R Programming: R Data Visualization, Book 3, (Paperback) $21.98
 $2198current price $21.98
R Programming R Programming: R Data Visualization, Book 3, (Paperback)
Data-Driven Security: Analysis, Visualization and Dashboards (Paperback) $46.07
 $4607current price $46.07
Data-Driven Security: Analysis, Visualization and Dashboards (Paperback)
Use R! Lattice: Multivariate Data Visualization with R, (Paperback) $41.86 Was $49.41
 $4186current price $41.86, Was $49.41$49.41
Use R! Lattice: Multivariate Data Visualization with R, (Paperback)
Data Wrangling and Visualization with R: A Comprehensive Guide: Cleaning, Transforming, and Visualizing Real-World Data , (Paperback) $29.99
 $2999current price $29.99
Data Wrangling and Visualization with R: A Comprehensive Guide: Cleaning, Transforming, and Visualizing Real-World Data , (Paperback)
GGPlot2 Essentials: Great Data Visualization in R, (Paperback) $22.99
 $2299current price $22.99
GGPlot2 Essentials: Great Data Visualization in R, (Paperback)
Predictive Analytics with SAS and R: Core Concepts, Tools, and Implementation, (Paperback) $47.88
 $4788current price $47.88
Predictive Analytics with SAS and R: Core Concepts, Tools, and Implementation, (Paperback)
Graph Data Modeling in Python: A practical guide to curating, analyzing, and modeling data with graphs, (Paperback) $44.85
 $4485current price $44.85
Graph Data Modeling in Python: A practical guide to curating, analyzing, and modeling data with graphs, (Paperback)
Customer ratings & reviews

- Free shipping
 Free Holiday returns until Jan 31
How do you want your item?

