


Data Visualization with Python and JavaScript: Scrape, Clean, Explore, and Transform Your Data, (Paperback)
Key item features
- Data Visualization with Python and JavaScript: Scrape, Clean, Explore, and Transform Your Data, (Paperback)
- Author: O'Reilly Media
- ISBN: 9781098111878
- Format: Paperback
- Publication Date: 2023-01-17
- Page Count: 566
Specs
Author, O'Reilly Media
Book format, Paperback
Genre, Computing & Internet
Pages, 566
Age group, Adult
About this item
Product details
How do you turn raw, unprocessed, or malformed data into dynamic, interactive web visualizations? In this practical book, author Kyran Dale shows data scientists and analysts--as well as Python and JavaScript developers--how to create the ideal toolchain for the job. By providing engaging examples and stressing hard-earned best practices, this guide teaches you how to leverage the power of best-of-breed Python and JavaScript libraries.
Python provides accessible, powerful, and mature libraries for scraping, cleaning, and processing data. And while JavaScript is the best language when it comes to programming web visualizations, its data processing abilities can't compare with Python's. Together, these two languages are a perfect complement for creating a modern web-visualization toolchain. This book gets you started.
You'll learn how to:
- Obtain data you need programmatically, using scraping tools or web APIs: Requests, Scrapy, Beautiful Soup
- Clean and process data using Python's heavyweight data processing libraries within the NumPy ecosystem: Jupyter notebooks with pandas+Matplotlib+Seaborn
- Deliver the data to a browser with static files or by using Flask, the lightweight Python server, and a RESTful API
- Pick up enough web development skills (HTML, CSS, JS) to get your visualized data on the web
- Use the data you've mined and refined to create web charts and visualizations with Plotly, D3, Leaflet, and other libraries
- Data Visualization with Python and JavaScript: Scrape, Clean, Explore, and Transform Your Data, (Paperback)
- Author: O'Reilly Media
- ISBN: 9781098111878
- Format: Paperback
- Publication Date: 2023-01-17
- Page Count: 566
Specifications
Publication date
Author
Book format
Genre
Warranty
Warranty information
Warnings
Similar items you might like
100 Mathematical Python Coding Exercises with Solutions Keys, (Paperback) $36.30
 $3630current price $36.30
100 Mathematical Python Coding Exercises with Solutions Keys, (Paperback)
Data Science with Python: AI Applications for Finance, (Paperback) $37.99
 $3799current price $37.99
Data Science with Python: AI Applications for Finance, (Paperback)
Data Analytics Complete Training: Master Excel, Python, SQL & Data Visualization with Practical Projects for Beginners, (Paperback) $29.99
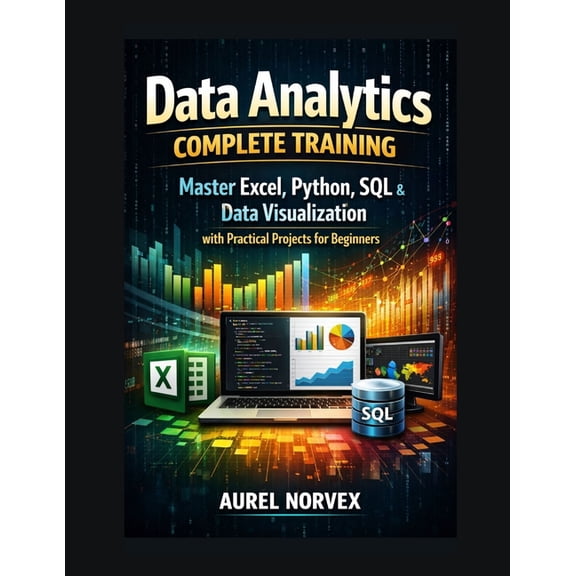 $2999current price $29.99
Data Analytics Complete Training: Master Excel, Python, SQL & Data Visualization with Practical Projects for Beginners, (Paperback)
The Data Analyst's Toolkit with Python: Master Data Cleaning, Visualization, and Automation Using Pandas, Plotly, and St, (Paperback) $18.99
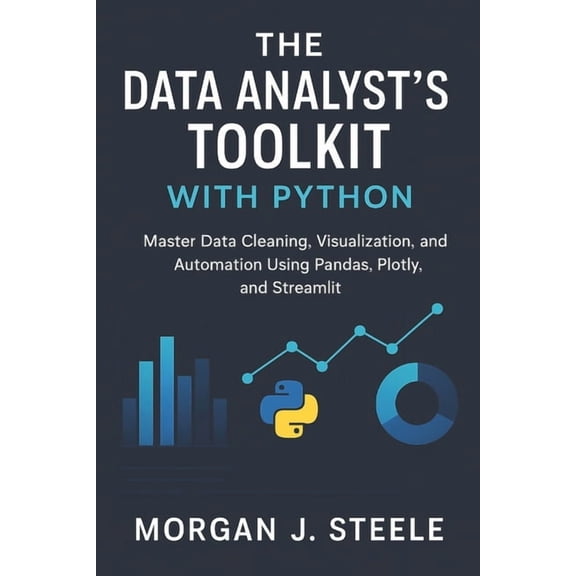 $1899current price $18.99
The Data Analyst's Toolkit with Python: Master Data Cleaning, Visualization, and Automation Using Pandas, Plotly, and St, (Paperback)
Earth Engine and Geemap: Geospatial Data Science with Python, (Paperback) $36.50
 $3650current price $36.50
Earth Engine and Geemap: Geospatial Data Science with Python, (Paperback)
Mastering Data Science with Python: Analyze, Visualize, and Model Data Using Powerful Libraries, (Paperback) $19.99
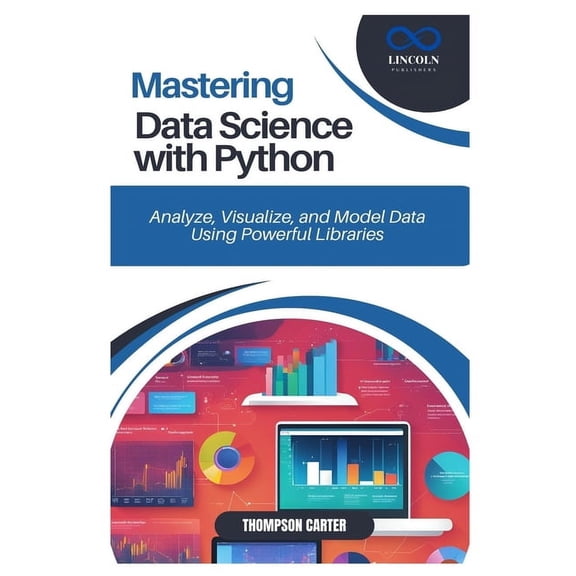 $1999current price $19.99
Mastering Data Science with Python: Analyze, Visualize, and Model Data Using Powerful Libraries, (Paperback)
In 50+ people's carts, Dungeon Crawler Carl (Paperback) $12.48 Was $14.98
In 50+ people's carts $1248current price $12.48, Was $14.98$14.98
Dungeon Crawler Carl (Paperback)
984.8 out of 5 Stars. 98 reviews4.8 out of 5 starsPython for Data Science and Machine Learning: The Only Book You Need to Master Python for DS and ML from Scratch: A Hand, (Paperback) $24.99
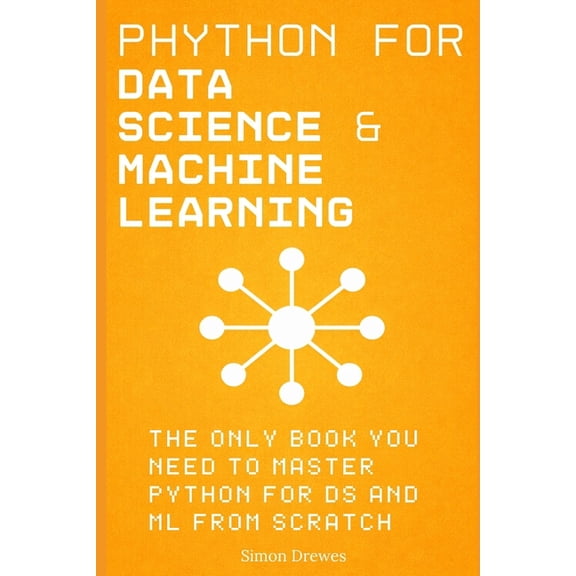 $2499current price $24.99
Python for Data Science and Machine Learning: The Only Book You Need to Master Python for DS and ML from Scratch: A Hand, (Paperback)
Scientific Python Specialist - Core Path Ultimate Pandas for Data Manipulation and Visualization: Efficiently Process and Visualize Data with Python's Most Popul, Book 2, (Paperback) $37.95
 $3795current price $37.95
Scientific Python Specialist - Core Path Ultimate Pandas for Data Manipulation and Visualization: Efficiently Process and Visualize Data with Python's Most Popul, Book 2, (Paperback)
MLI Generative AI Python 3 Data Visualization Using Google Gemini, (Paperback) $33.89
 $3389current price $33.89
MLI Generative AI Python 3 Data Visualization Using Google Gemini, (Paperback)
The Osint Analyst Series: Intelligence T OSINT Automation: Python & APIs for Intelligence Gathering, Book 12, (Paperback) $27.99
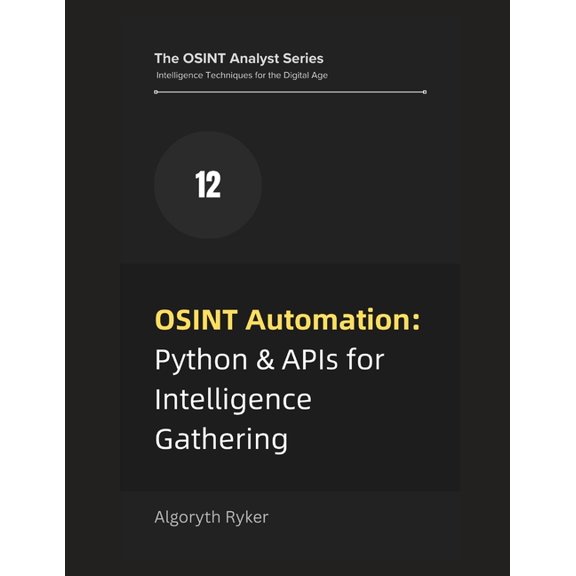 $2799current price $27.99
The Osint Analyst Series: Intelligence T OSINT Automation: Python & APIs for Intelligence Gathering, Book 12, (Paperback)
SAS, Python and R: A Cross-Reference Guide for Data Science, (Paperback) $36.69
 $3669current price $36.69
SAS, Python and R: A Cross-Reference Guide for Data Science, (Paperback)
Exploring and Visualizing US Census Data with R: Using tidycensus and tidyverse to import, manipulate, explore, and visu $36.69 $52.41/lb
 $3669current price $36.69$52.41/lb
Exploring and Visualizing US Census Data with R: Using tidycensus and tidyverse to import, manipulate, explore, and visu
The Data Analytics Playbook: Your Guide to Analytics in Python, (Paperback) $29.99
 $2999current price $29.99
The Data Analytics Playbook: Your Guide to Analytics in Python, (Paperback)
Big Data Analytics with Python: Practical Applications for Business, (Paperback) $34.29
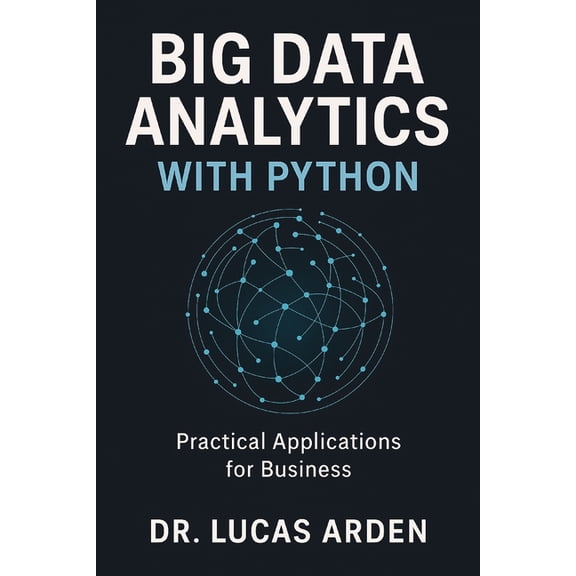 $3429current price $34.29
Big Data Analytics with Python: Practical Applications for Business, (Paperback)
Data Visualization Blender/Scripting/Python All-in-One, (Paperback) $39.99
 $3999current price $39.99
Data Visualization Blender/Scripting/Python All-in-One, (Paperback)
Python for Data Science: Python and Data Science, (Paperback) $19.99
 $1999current price $19.99
Python for Data Science: Python and Data Science, (Paperback)
Big Book On Python For Data Analysis : How To Solve A Wide Range Of Data Analysis Problems: Advanced Python Books (Paperback) $11.50
 $1150current price $11.50
Big Book On Python For Data Analysis : How To Solve A Wide Range Of Data Analysis Problems: Advanced Python Books (Paperback)
Data Visualization with Python: Create Stunning Dashboards and Insights, (Paperback) $19.99
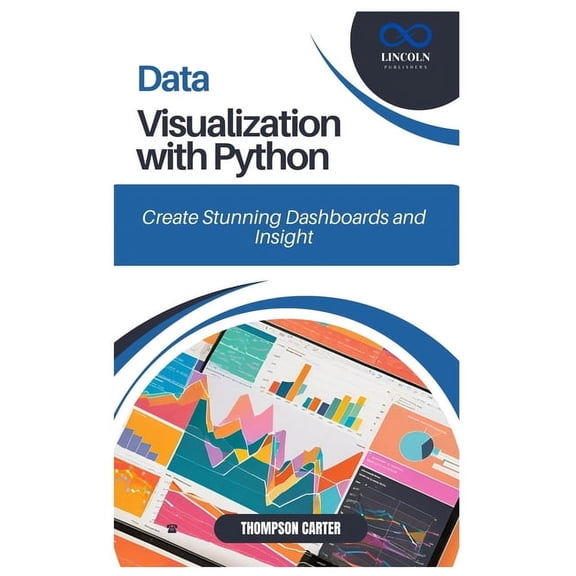 $1999current price $19.99
Data Visualization with Python: Create Stunning Dashboards and Insights, (Paperback)
Machine Learning with Spark and Python: Essential Techniques for Predictive Analytics, (Paperback) $35.89
 $3589current price $35.89
Machine Learning with Spark and Python: Essential Techniques for Predictive Analytics, (Paperback)
Customer ratings & reviews

- Free shipping
 Free 90-day returns
How do you want your item?


